Lamont outperforms statewide result in Woodbridge while the town’s Democratic registration continues its downward trend
Town turnout falls sharply from 2018 as 315 fewer voters participated despite more eligible voters than in the last contested gubernatorial primary

Woodbridge Democrats turned out at a higher rate than Democrats statewide in Tuesday's gubernatorial primary, but substantially fewer local voters participated than when Gov. Ned Lamont last faced a primary challenge eight years ago.
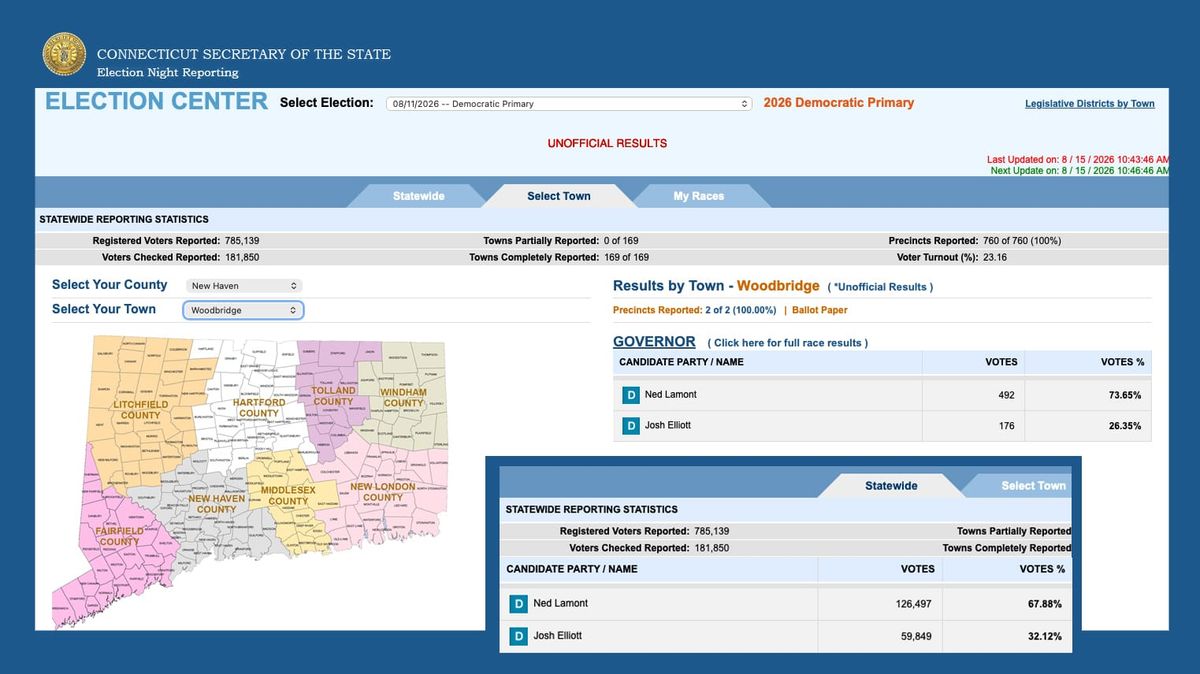
Unofficial results reported by the Connecticut Secretary of the State show Lamont prevailing in Woodbridge with nearly three-quarters of the vote, receiving 492 votes, or 73.65%, compared with 176 votes, or 26.35%, for challenger Josh Elliott.
Statewide, Lamont defeated Elliott by more than 2-to-1, 67.88% to 32.12%, securing the Democratic nomination and advancing to face Republican state Sen. Ryan Fazio of Greenwich in the November general election.
While Woodbridge favored Lamont by a somewhat wider margin than Democratic voters statewide, a comparison with the last contested Democratic gubernatorial primary reveals a larger shift in participation. In 2018, when Lamont faced then-Bridgeport Mayor Joe Ganim for the Democratic nomination, 983 of Woodbridge's 2,349 eligible Democratic voters participated, for turnout of 41.85%, according to official Secretary of the State results.
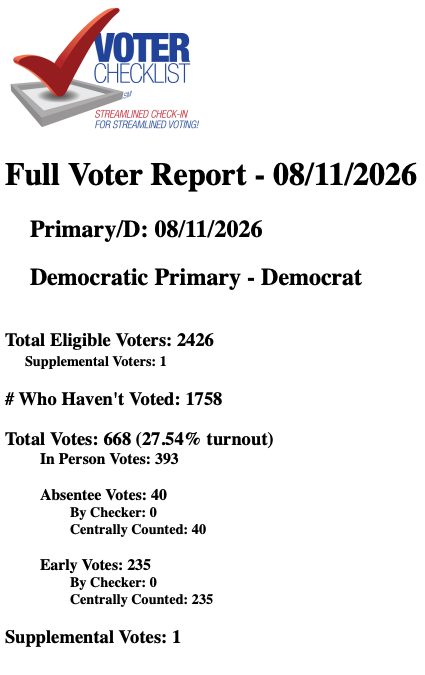
This year, the local Voter Checklist report shows 668 of 2,426 eligible Democrats voting, for turnout of 27.54%. That represents a decline of 14.31 percentage points from 2018 — and 315 fewer Woodbridge voters participating — despite the town having 77 more voters eligible to cast a Democratic primary ballot than it did eight years ago.
There were no gubernatorial primaries to compare in 2020 or 2022, making 2018 the most recent comparable Democratic governor primary.
Woodbridge Democratic gubernatorial primary | 2018 | 2026 |
Eligible voters | 2,349 | 2,426 |
Voters participating | 983 | 668 |
Turnout | 41.85% | 27.54% |
Lamont vote | 842 (87.07%) | 492 (73.65%) |
Opponent | Joe Ganim: 125 (12.93%) | Josh Elliott: 176 (26.35%) |
The decline in Woodbridge turnout was also considerably steeper than the decline statewide. Statewide Democratic primary turnout was 28.59% in 2018, compared with 23.16% this year, a decline of 5.43 percentage points. Woodbridge, by comparison, went from 13.26 percentage points above the statewide turnout rate in 2018 to about 4.4 points above it this year.
Early voting accounts for more than a third of Woodbridge ballots
This year's primary was also conducted under voting rules and procedures that did not exist when Lamont faced Ganim in 2018, most notably the availability of early voting following implementation of a constitutional amendment approved by Connecticut voters in 2022.
Early voting in Woodbridge was offered from Aug. 3 through Aug. 9 (see WTC article 7/20/2026). Of the 668 voters recorded by the local Voter Checklist system, 393 voted in person on Election Day, while 235 voted during the seven-day early voting period and another 40 voted by absentee ballot.
That means 275 voters — about 41% of participants — voted before Election Day, including more than one-third of all voters through early voting alone.
Democratic enrollment continues decline from 2022 peak
The primary also provides a new data point in a voter enrollment trend the Woodbridge Town Chronicle examined last August (see WTC article 8/25/2025). At that time, local registration records showed that Democratic enrollment had declined more than either Republican or unaffiliated enrollment since November 2022, while unaffiliated voters had again become Woodbridge's largest voter group.
In November 2022, Woodbridge had 2,633 registered Democrats. By May 2025, that number had fallen to 2,485. The decline continued, with the November 2025 municipal election voter report listing 2,446 eligible Democratic voters, while this week's primary report lists 2,426.
Taken together, those figures show a decline of 207 Democratic voters, or about 7.9%, from November 2022 to August 2026.
Date | Democratic voters |
Nov. 2022 | 2,633 |
Nov. 2023 | 2,513 |
Nov. 2024 | 2,588 |
May 2025 | 2,485 |
Nov. 2025 | 2,446 |
Aug. 2026 | 2,426 |
The longer view, however, adds important context. Despite the decline from the 2022 high, Woodbridge still had 77 more voters eligible to participate in this year's Democratic primary than it did in 2018.
That makes the turnout comparison particularly notable: for this year's Democratic primary, the pool of eligible Democratic voters in Woodbridge was slightly larger than eight years ago, while the number who actually participated was nearly one-third smaller.